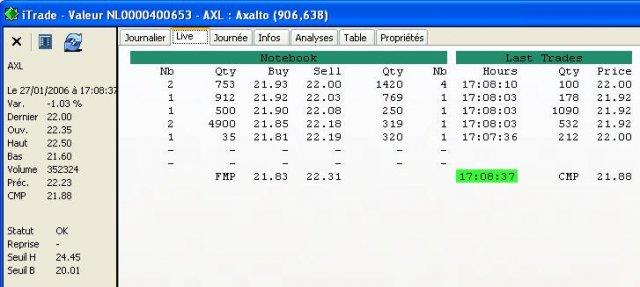
Candlestick Charting
Advertisement
Legacy Charting v.7 5
Legacy Charting 7.0 is highly adaptable software for creating superb quality ancestor, hourglass, descendant, bow tie, fan and DNA charts.
Advertisement
Darvas End of Day Stock Charting v.1.1
This stock charting program has in-built Darv Box indicators to help you trade momentum
TCHART Cycle Time Charting Program v v.50.0
TCHART is a time study tool that constructs Gantt charts. It is a computer program written in VBA (Visual Basic for Applications) and runs in Excel. It depicts the sequence of events of a repeating task. It is similar in appearance to many Gantt
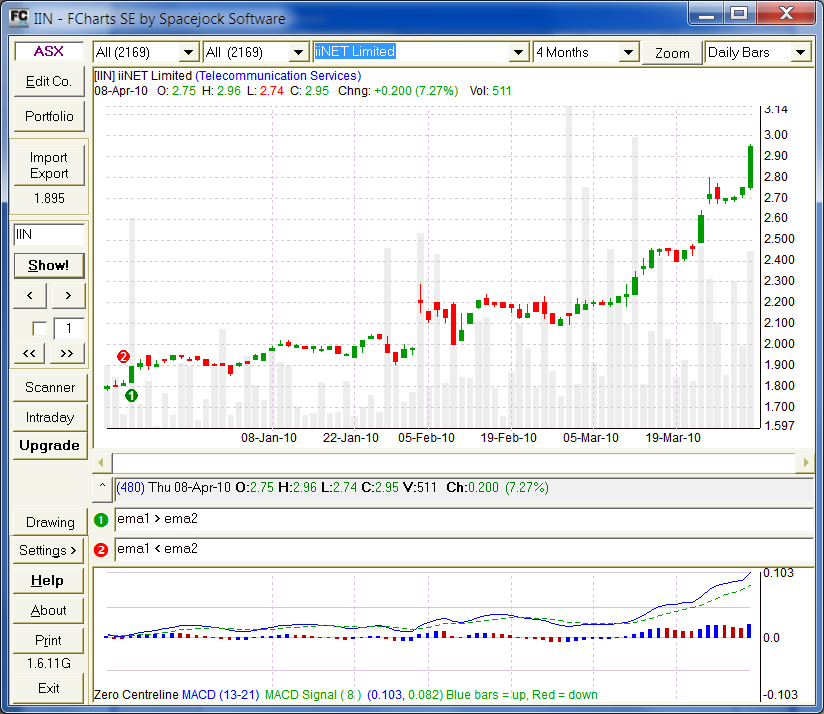
FCharts 1.5.97l v.1.0
FCharts SE is a free stock charting program which will import price data from a wide range of sources, displaying it as OHLC, Candlestick and Line charts.
FusionCharts Free
FusionCharts Free is a flash charting component that can be used to render data-driven & animated charts for your web applications and presentations. It is a cross-browser and cross-platform solution that can be used with ASP.NET, ASP, PHP, JSP,

TickInvest Free Edition v.1.2.0
TickInvest is a stock charting and technical analysis software with realtime and eod charts. 29 Indicators are ready to use, to analyze your favorite stocks. Drawing tools helps you to keep track of resistance and support zones.
TickInvest Free Edition for Linux v.1.0.0
Stock charting and technical analysis software with a user-friendly interface targeted for stock investors and realtime traders. Supported dataproviders are Yahoo and Interactive Brokers. Realtimecharts, Indicators, Easy to use script language...
FCharts 1.5.95h v.1.0
FCharts SE is a free stock charting program which will import price data from a wide range of sources, displaying it as OHLC, Candlestick and Line charts. It has a number of built-in indicators (MACD, RSI, Exponential and Standard Moving Averages),
ChartNexus v.3. 1. 2001
Behind every successful trader or investor is a stock market charting software. We are lowering your operating cost as a trader and investor by offering you ChartNexus Charting (Stock Market Analysis) Software for FREE!
PhoenixAI v.1.153.54
With over 140 technical indicators and tools, PhoenixAI is a formidable charting application. But that's only the tip of the iceberg.
XYGraph v.1 10
XYGraph is a native .NET charting component showing data in a cartesian graph (X,Y). Controls from componentXtra gives royalty free software integration.